Fictional examples welcome. You never need to disclose your income, bills or family circumstances.
Talk first
When does advice to “tighten your belt” become an evasion of the underlying problem?
Which is more useful for judging living standards: a national average, a household budget or reported experience?
What the average cannot afford to overlook
The same economic announcement can produce relief, disbelief or indifference. A national average is designed to summarize, yet that very strength limits what it can reveal about a particular household. Someone whose rent has recently reset, whose commute requires a car or whose diet cannot easily change may experience pressure that is poorly represented by a single headline. The discrepancy deserves investigation rather than a choice between trusting statistics and trusting people.
A crucial distinction is between disinflation and falling prices. A lower positive inflation rate slows the erosion of purchasing power; it does not restore the earlier price level. Equally, a year of real wage growth does not establish that previous losses have been recovered. Starting dates therefore matter. Our one-, five- and ten-year CPI comparisons deliberately share an endpoint, while the OCU evidence belongs to a separate supermarket study.
These sources are complementary rather than interchangeable. OCU highlights substantial variation between goods and outlets. The general CPI spans a wider set of household purchases and reflects expenditure weights. Neither a handful of striking product increases nor a personal shopping receipt can stand in for the overall index. Conversely, an index cannot determine whether a particular family can afford adequate housing, transport or care.
The apparent simplicity of household solutions can also conceal assumptions. Shopping around requires time and access to alternatives; batch cooking assumes equipment, storage and a manageable schedule. Buying durable goods may be cheaper over several years while remaining unaffordable today. People with financial slack can respond strategically; those living close to the edge may pay more precisely because they cannot finance the option that would save money later.
Cutbacks are not purely monetary. Giving up a weekly activity may also mean losing companionship. Making do with unreliable transport could threaten punctuality at work. A small treat can sustain morale, while abandoning it may barely affect a structural shortfall. None of this means spending choices are irrelevant. It means their consequences should be evaluated in context rather than judged through a moral hierarchy of respectable and frivolous purchases.
Pay comparisons require similar discipline. Average gross wage costs are not median take-home earnings, and changes in the composition of employment can move an average. Comparing wage and price growth over the same period is necessary but insufficient: hours, taxes, benefits and household spending patterns also influence the outcome. A carefully qualified estimate is more informative than a precise-looking claim about what every worker has gained.
The case for regulating prices turns on mechanism and design. A targeted, temporary ceiling in a disrupted market may buy time; a broad ceiling that leaves suppliers unable to cover costs may undermine availability. Compensating suppliers changes the fiscal cost rather than making it disappear. Cash support preserves choice but raises questions about eligibility and funding. Tax relief depends partly on pass-through, while stronger competition or supply may take longer to deliver.
A defensible policy must specify its purpose. Is it intended to prevent immediate hardship, reduce measured inflation, restore purchasing power or change the structure of a market? Those goals overlap but are not identical. The strongest classroom proposal will state whose position improves, which tradeoff it accepts, what evidence would trigger revision and when the intervention should end.
Device voice; no downloadable recording.
Original classroom writing. Research snapshot: 13 November 2026.
The story in three charts
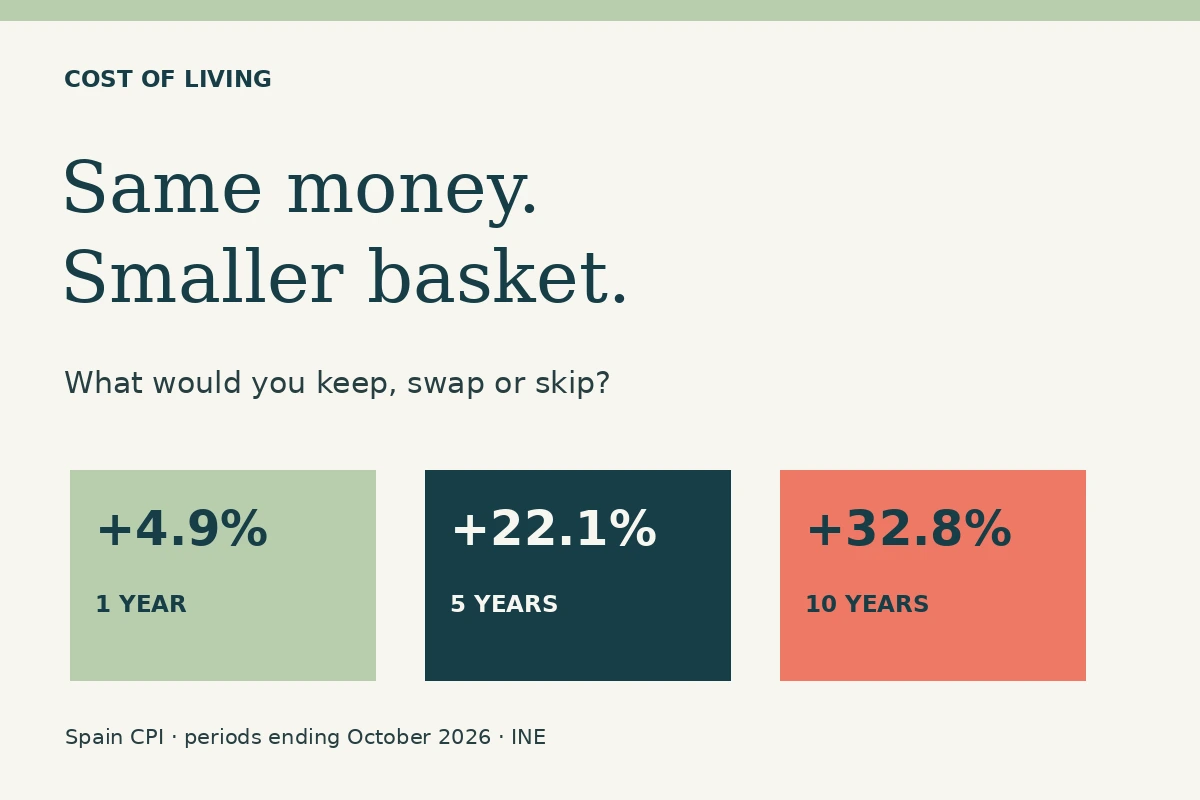
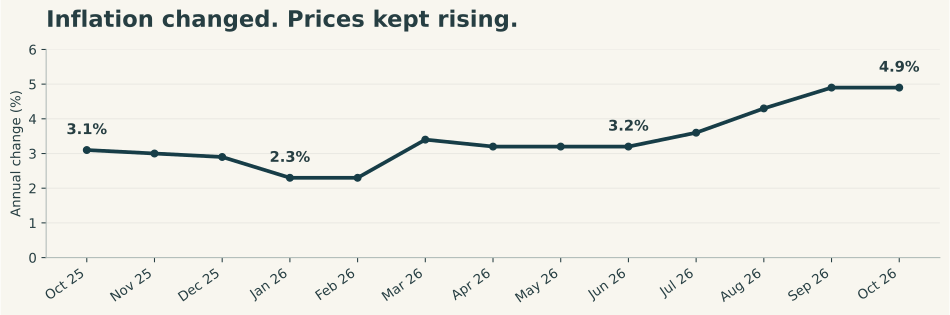
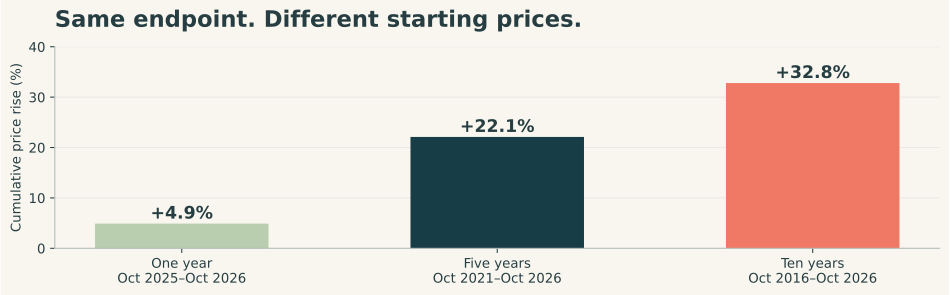
Spain · annual CPI rate, each month compared with the same month a year earlier. These are not month-on-month increases. INE; October 2025–October 2026. Latest release: 13 November 2026.Spain · national general CPI, same-month comparisons ending October 2026. One year: +4.9%; five years: +22.1%; ten years: +32.8%. The periods overlap: do not add them. Illustrative equivalent of a €100 basket: €104.90, €122.10 or €132.80, respectively. Not the prices of a specific grocery list.
Construct a defensible claim from each chart and a claim it cannot support.
What does a percentage-point change describe in the monthly CPI chart?
How might choosing a different starting date alter a narrative about recovery?
Do not add overlapping periods. A slowing positive rate is not a falling price level.
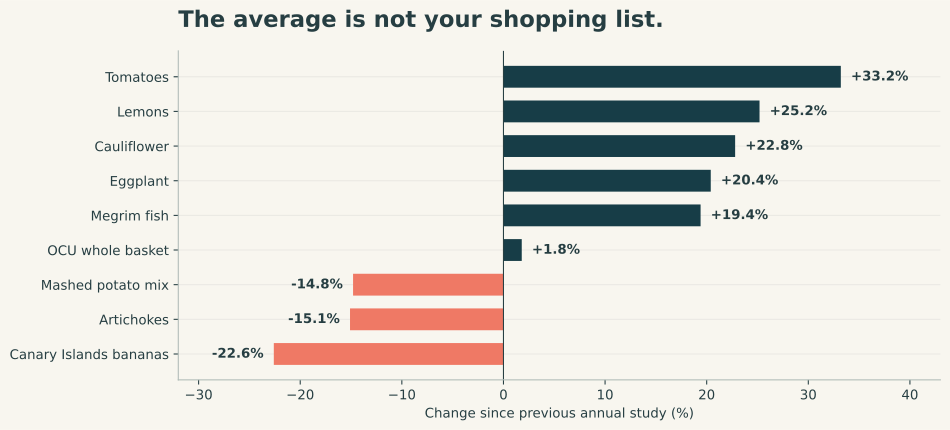
Selected products from OCU’s 2026 annual supermarket study compared with its previous study. Prices collected April–May 2026. Percentage changes, not euro prices; selected examples are not a representative average. The whole basket also includes household and hygiene products.
Why investigate a gap between a headline and reported pressure?
Why does real wage growth not prove full recovery?
What could a small treat provide besides consumption?
Why specify a policy’s purpose?
Answer in pairs and identify a supporting sentence. Keep opinion separate from a reading fact.
Budget food, with a side of economics
A box of Hamburger Helper contains pasta and sauce mix, combined with ingredients such as ground beef and milk to stretch a meal. Think of it alongside instant ramen, a familiar US college-budget option. David Hebert’s 2025 Daily Economy commentary uses demand for budget meals to question reassuring aggregates. Treat the “Hamburger Helper index” as an informal signal, not a standardized measure: prices, promotion, convenience or nostalgia can also influence sales. What is your budget-meal equivalent?
Spain, Q2 2026 vs Q2 2025: average gross wage cost per worker rose 4.0%; CPI annual rates were 3.2% in April, May and June. Using these rounded figures gives approximately 0.8% real growth: 1.04 ÷ 1.032 − 1. This is a broad average comparison—not each worker’s pay raise, median earnings or take-home income.
In an ONS survey of adults in Great Britain in August 2026, 59% reported spending less on non-essentials because of rising living costs, 43% shopping around more and 38% spending less on food shopping and essentials. These are self-reports, not Spanish statistics; people could take more than one action.
A worker receives 3% more pay while their usual basket costs 5% more. Has the pay rise improved what they can buy? What else would you want to know?
Optional authentic listening
Federal Reserve Education · Inflation
Watch only the opening three minutes, or stop earlier after the basket explanation. Historical prices are examples from the video, not today’s prices. This is a US explainer; its policy target and methodology require context.
Which qualification prevents the historical prices from proving greater past affordability?
What limitations would you add when applying a single basket to different households?
No playback? Teacher-read alternative
Inflation is a broad increase in prices over time. A low price in the past does not prove something was easier to afford, because pay was different too. A price basket combines many purchases. It describes an average pattern, while households spend their money differently.
Official page and transcript checked; video playback has not been verified here. The fallback is original classroom narration, not an authentic transcript.
What would you protect?
When is making do a sensible adaptation, and when is it deferred harm?
Which apparently frugal choice transfers costs into unpaid time?
How should social participation figure in a basic household budget?
What would make budget advice useful without making it patronizing?
What would a median-pay measure add to an average?
Should inflation protection prioritize flat increases or percentage increases?
How could a pay policy protect workers while accommodating small employers?
What evidence would distinguish recovery from merely slower deterioration?
Design the narrowest price cap you could defend.
What enforcement problem would be hardest to solve?
How would you compare targeted cash with temporary tax relief?
Which indicators should determine whether support is extended or withdrawn?
Why do supermarket experiences carry political force?
How can selective product examples illuminate a problem without representing it?
What is a fair way to challenge someone’s interpretation of their own circumstances?
Which missing evidence would most change your current view?
That conclusion holds only insofar as ___.
The aggregate trend should not obscure ___.
I would support this measure provided that ___.
The immediate benefit has to be set against ___.
A stronger test of this claim would be ___.
Keep, swap or skip
Absorb the fictional €80 cost shock, then test your plan against a household with no car and little storage. Recommend a short-term intervention and a longer-term response. Specify eligibility, funding, one unintended consequence and an exit condition.
Item
Euros per month
Housing and bills
€1050
Food and household goods
€420
Transport
€160
Health and essential care
€90
Phone and internet
€60
Social life and subscriptions
€120
Savings / emergency buffer
€100
Income €2,100 · current spending €2,100 · new cost €80.
Possible changes—fictional estimates, not guaranteed savings
Possible change
Monthly saving
Switch some brands / reduce food waste
€25
Cancel one subscription
€15
Two fewer takeout meals
€30
Walk or use an existing bus pass for suitable trips
€20
Renegotiate phone plan
€10
Delay a non-urgent purchase
€30
Reduce the savings contribution this month
€40
Compare quality, time, transport and access. Do not cut essential care or recommend skipping meals.
Final outcome: Agree on a plan, defend one protected priority and explain a tradeoff.
That conclusion holds only insofar as ___.
The aggregate trend should not obscure ___.
I would support this measure provided that ___.
The immediate benefit has to be set against ___.
A stronger test of this claim would be ___.
Should the government step in?
Compare the three options. What problem do you want to solve first?
Temporary price ceiling
Set a legal maximum for selected essential goods. It may provide immediate relief; if set below a viable supply price without support, it can discourage supply or create shortages. Define the product, duration and enforcement.
Targeted support
Give eligible households cash or vouchers. This can focus help on need; eligibility rules, missed applicants, funding and price effects need attention.
Tax relief and competition
Reduce selected consumption taxes or improve competition and price transparency. Benefits depend on how much reaches shoppers; tax cuts cost public revenue and competition measures can take time.
Who benefits? Who pays? What could go wrong? How would you check whether it worked?
Take it further
Write and defend a 90-second policy recommendation. A partner identifies its strongest assumption; revise the recommendation without abandoning its core objective.
Exit ticket
One useful expression. One claim you can support with data. One choice or opinion you reconsidered.
60-minute route: warmer 5; reading and comprehension 12; charts 8; vocabulary and useful language 8; selected discussion 12; decision and exit ticket 15. Optional media replaces part of discussion; add the extension and policy clinic for 90 minutes.
Use conditional reasoning and distinguish policy mechanism from desired outcome. An aggregate wage/CPI ratio is an approximate index comparison, not a finding about each worker. Encourage explicit criteria for changing a view.
Reading answers
The index and a household’s exposure can differ without either being false.
Earlier losses and the starting date still matter.
Morale, companionship or participation; context matters.
Hardship relief, lower measured inflation and structural change are distinct objectives.
Chart answers
Examples: the annual rate rose toward October; it does not show every household’s inflation. Product changes vary; the selection cannot establish the average. Longer accumulated rises are larger; the periods must not be added.
A change between two rates, e.g. 3.1% to 4.9% is +1.8 percentage points.
A shorter recovery interval can omit earlier losses or begin at an unusual price level.
Budget example: €25 brand/waste changes + €15 subscription + €30 fewer takeout meals + €10 phone plan = €80. These are fictional estimates. Do not count the same food saving twice. Teen plan: picnic €20 total or free local event up to €10 with optional snacks; café €28 exceeds €24.
Listening guidance: Old prices need old pay for an affordability comparison; a basket measures a collection, not each household. Answer using the excerpt actually played; use the original fallback if unavailable.
Anticipated pitfalls: Slower positive inflation is not falling prices; cumulative periods overlap; percent and percentage points differ; nominal sales and sales volumes differ; cheap food is not automatically an “inferior good.” The food aside should take about two minutes, not become a major section.